Logistic Regression
Logistic regression is a supervised learning method, but notwithstanding its name, it is used for classification and class probability estimation, not regression.
For this exercise, I am going to use the creditcard.csv file. Initially downloaded from Kaggle, this dataset contains credit card transactions made over two days in September 2013. Over this period, we have 492 frauds out of 284,807 transactions. The dataset is highly unbalanced, as the positive class (frauds) account for only 0.172% of all transactions. The target (fraud) variable is indicated by the field “Class”
Start by importing the necessary libraries.

Import the data, specify the dependent (target) and independent variables

Split the dataset into a training and testing dataset. This way we can test the accuracy of the model later on.

Create the Logistic Regression model

Create and plot a confusion matrix, and calculate model accuracy

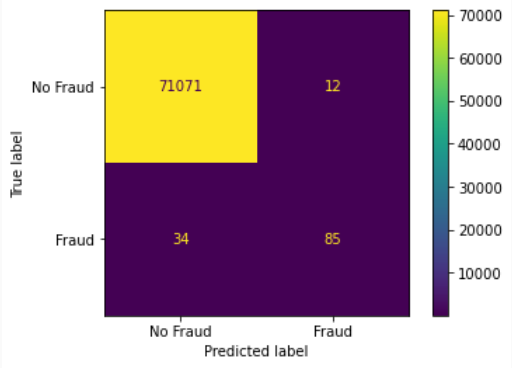
The confusion matrix has two axes. A “true” axis and a “predicted” axis. We have 85 instances where the True and Predicted labels indicate a fraudulent transaction. The model predicted a fraud, and there was an actual fraud. There were 71,071 instances where the model predicted “No Fraud” and there was actually no fraudulent transactions.
The overall accuracy of the model can be calculated as (71,071 + 85) / (71,071 + 85 + 12 + 34) = 99.93% At first glance, this sounds great, but we only have 119 fraudulent transactions out of a total of 71,202. Thus our base accuracy rate, if we classified every transaction as “no fraud,” would be 99.84%
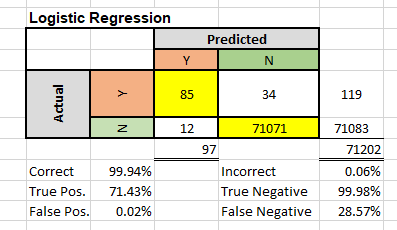
More importantly, would be the false positive and true positive accuracy. Without a model, if we classified every transaction as “non-fraudulent”, we would have an overall accuracy of 99.84%, but a False Positive and True Positive rate of 0%
Using a model, we have twelve instances where the model predicted a fraudulent transaction, but there were no frauds (false positive rate of 0.02%). For the true positive rate, we have 85 instances where the model predicted a fraudulent transaction, which was in fact fraudulent. This would give us a true positive rate of 71.43% . (85 / (85+34))
Attach the predictions to the original dataset and export. We now have two fields. The original "Class" field and the new "predict" field

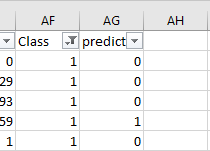
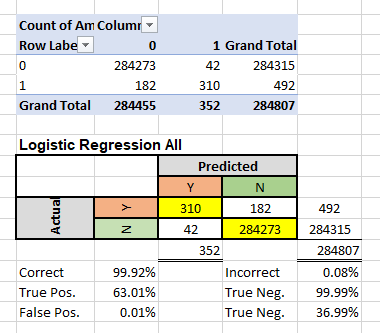
After the new "predict" variable is attached to the whole table, we can create a pivot table and look at the positive and negative ratios again. The numbers are going to be different as we are now measuring the predicted classification against the whole dataset.
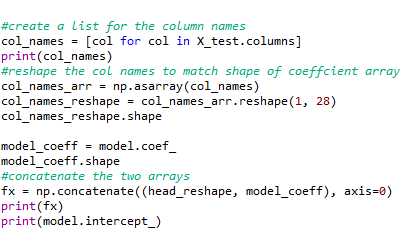
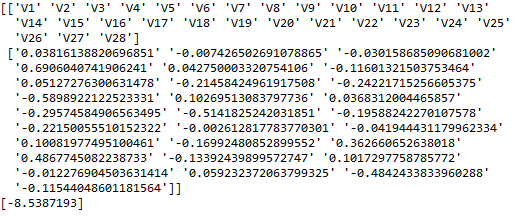
Finally, we can create the logistic regression function by using the coefficients and intercept
