
Linear Regression
I will be using a dataset on wine quality downloaded from the UCI Machine Learning repository, winequality-red.csv. As I try to keep the model as simple as possible, I will only be looking at two fields. Ph and Citric acid and the correlation between the two.The same process can be used to look at all the fields, though it would complicate the visualization of the final plots.
Start by importing the necessary libraries.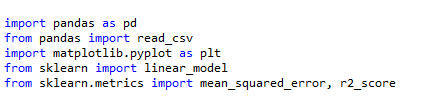
Import the data, specify the dependent (target) and independent variables. I am only looking at the correlation between Citric Acid and the Ph in the wine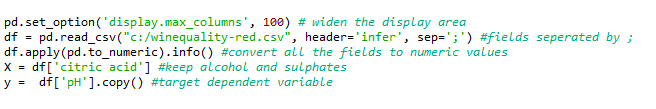
Split the dataset into a training and testing dataset.

Create the Linear Regression model

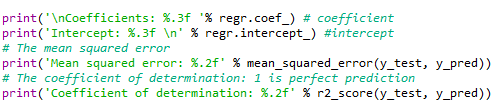
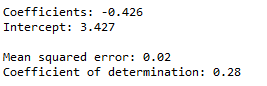
Calculate statistics on the model
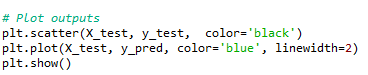
Finally, plot the results
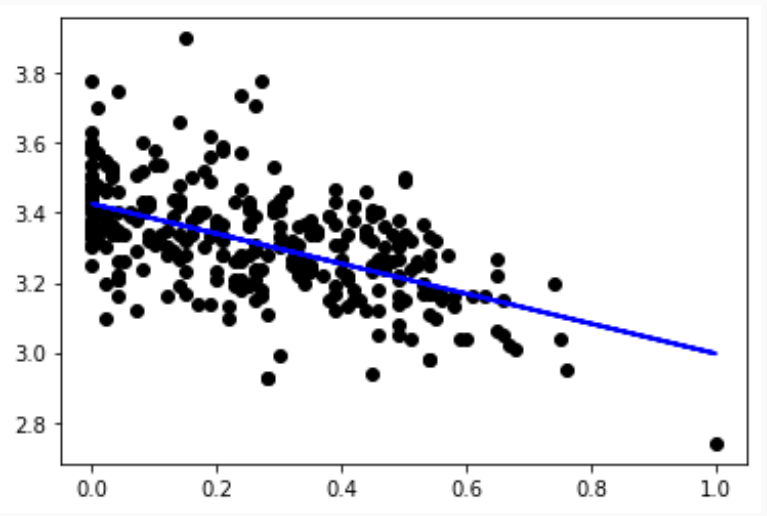
We can see there is a negative correlation between Citric Acid on the X axis and pH on the Y axis on the plot and also on negative coefficient of -0.426. This means as Citric Acid in the wine goes up, the pH goes down, as expected.